The UK forecast flips from high to low
Runs of 14–17 Oct · UK pressure anomaly +15 → −7 hPa
And the flip was right
Valid 19–21 Oct · the UK high collapses on 20 Oct as the 16 Oct run forecast
A Greenland/Iceland block that never happened
Valid 18–20 Oct · 13 Oct run errors of +380 to +500 m near Iceland; no member close
A wave packet weakened over North America, but not in the forecast
17–18 Oct · real envelope 38 → 27 m/s; 13 Oct run 44 → 48 m/s
The trough dug south, split and lifted out
16–18 Oct · reached 36°N (forecast 39°N; only 4 of 50 members got that far), then ejected on a 90 m/s jet
A long Gulf-to-Newfoundland rain band: a sign of the trough's path, not its driver
17–19 Oct · 40–60% underplayed in the 13 Oct run; a latent-heating test finds no driving role
A short wave from the NE Pacific dug further south and deeper than forecast
14–17 Oct · 13 Oct run: wrong track after the Rockies; 14 Oct run: right track, too weak
The ridge right behind the wave was sharper than forecast, steering it south
14–16 Oct · radiosondes saw the wave from landfall; the error then grew over land
A small upper low over the Four Corners: the trough's phasing partner
14–16 Oct · well forecast; the wave merged with it in reality, but rarely came close enough in the forecasts
AIFS-ENS, ECMWF's machine-learnt ensemble, made the same mistake
Runs of 13–17 Oct · same short-wave track error, same over-strong packet, flipped no earlier
Typhoon Koguma seeded the packet over the Pacific
13–16 Oct · its packet was forecast well, so it isn't where the forecast went wrong
The UK week flipped from +15 hPa to −7 hPa over four runs
A steady slide across the 14–17 Oct runs, not one bad run.
Established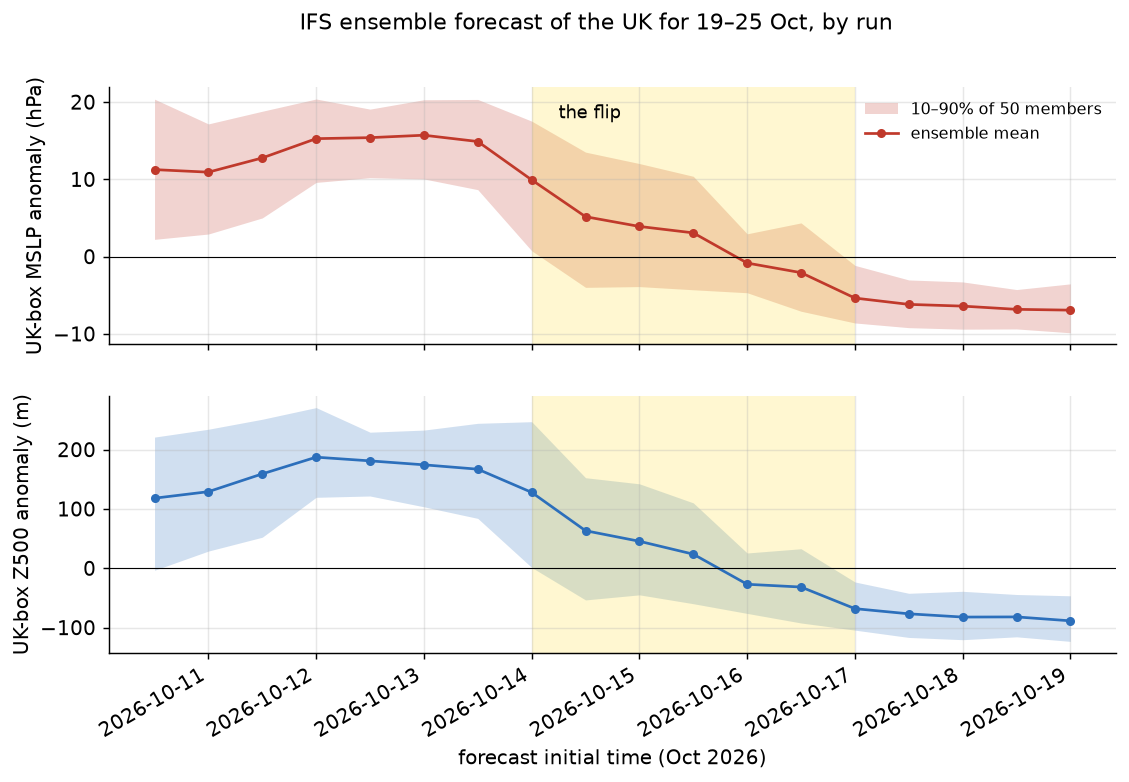
The numbers
- 12–13 Oct runs: MSLP +15 hPa, Z500 +170 to +190 m, 100% of members high.
- 14 Oct 00z → 12z: +10 → +5 hPa; members high 94% → 78%.
- 15 Oct: +3 to +4 hPa (70% high). 16 Oct 00z: −1 hPa (42% high).
- From 17 Oct: −5 to −7 hPa, Z500 −70 to −90 m, 0–6% of members high.
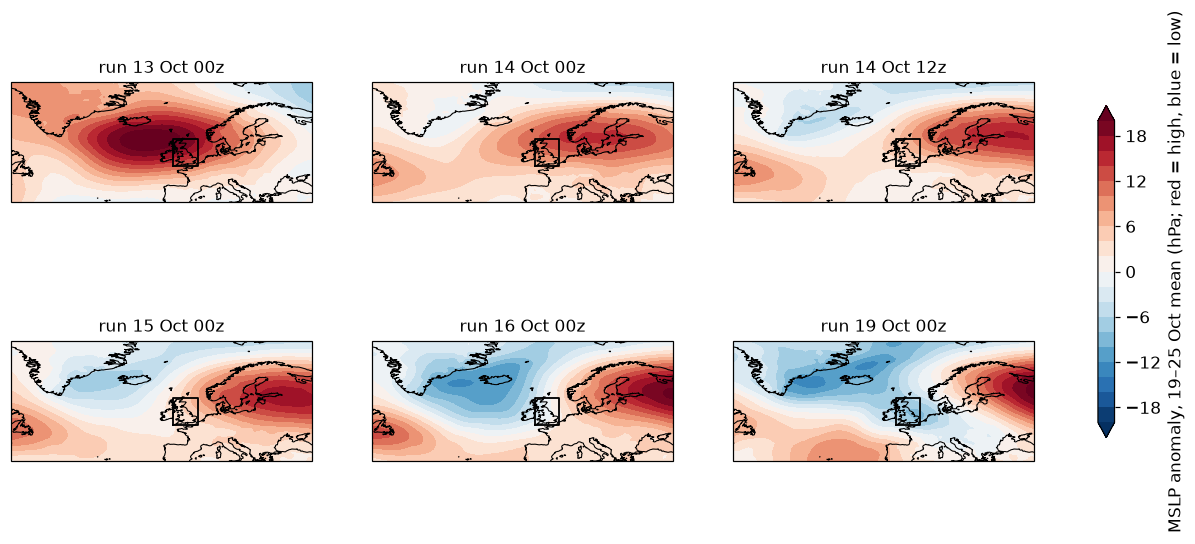
The ECMWF extended-range charts that showed the flip
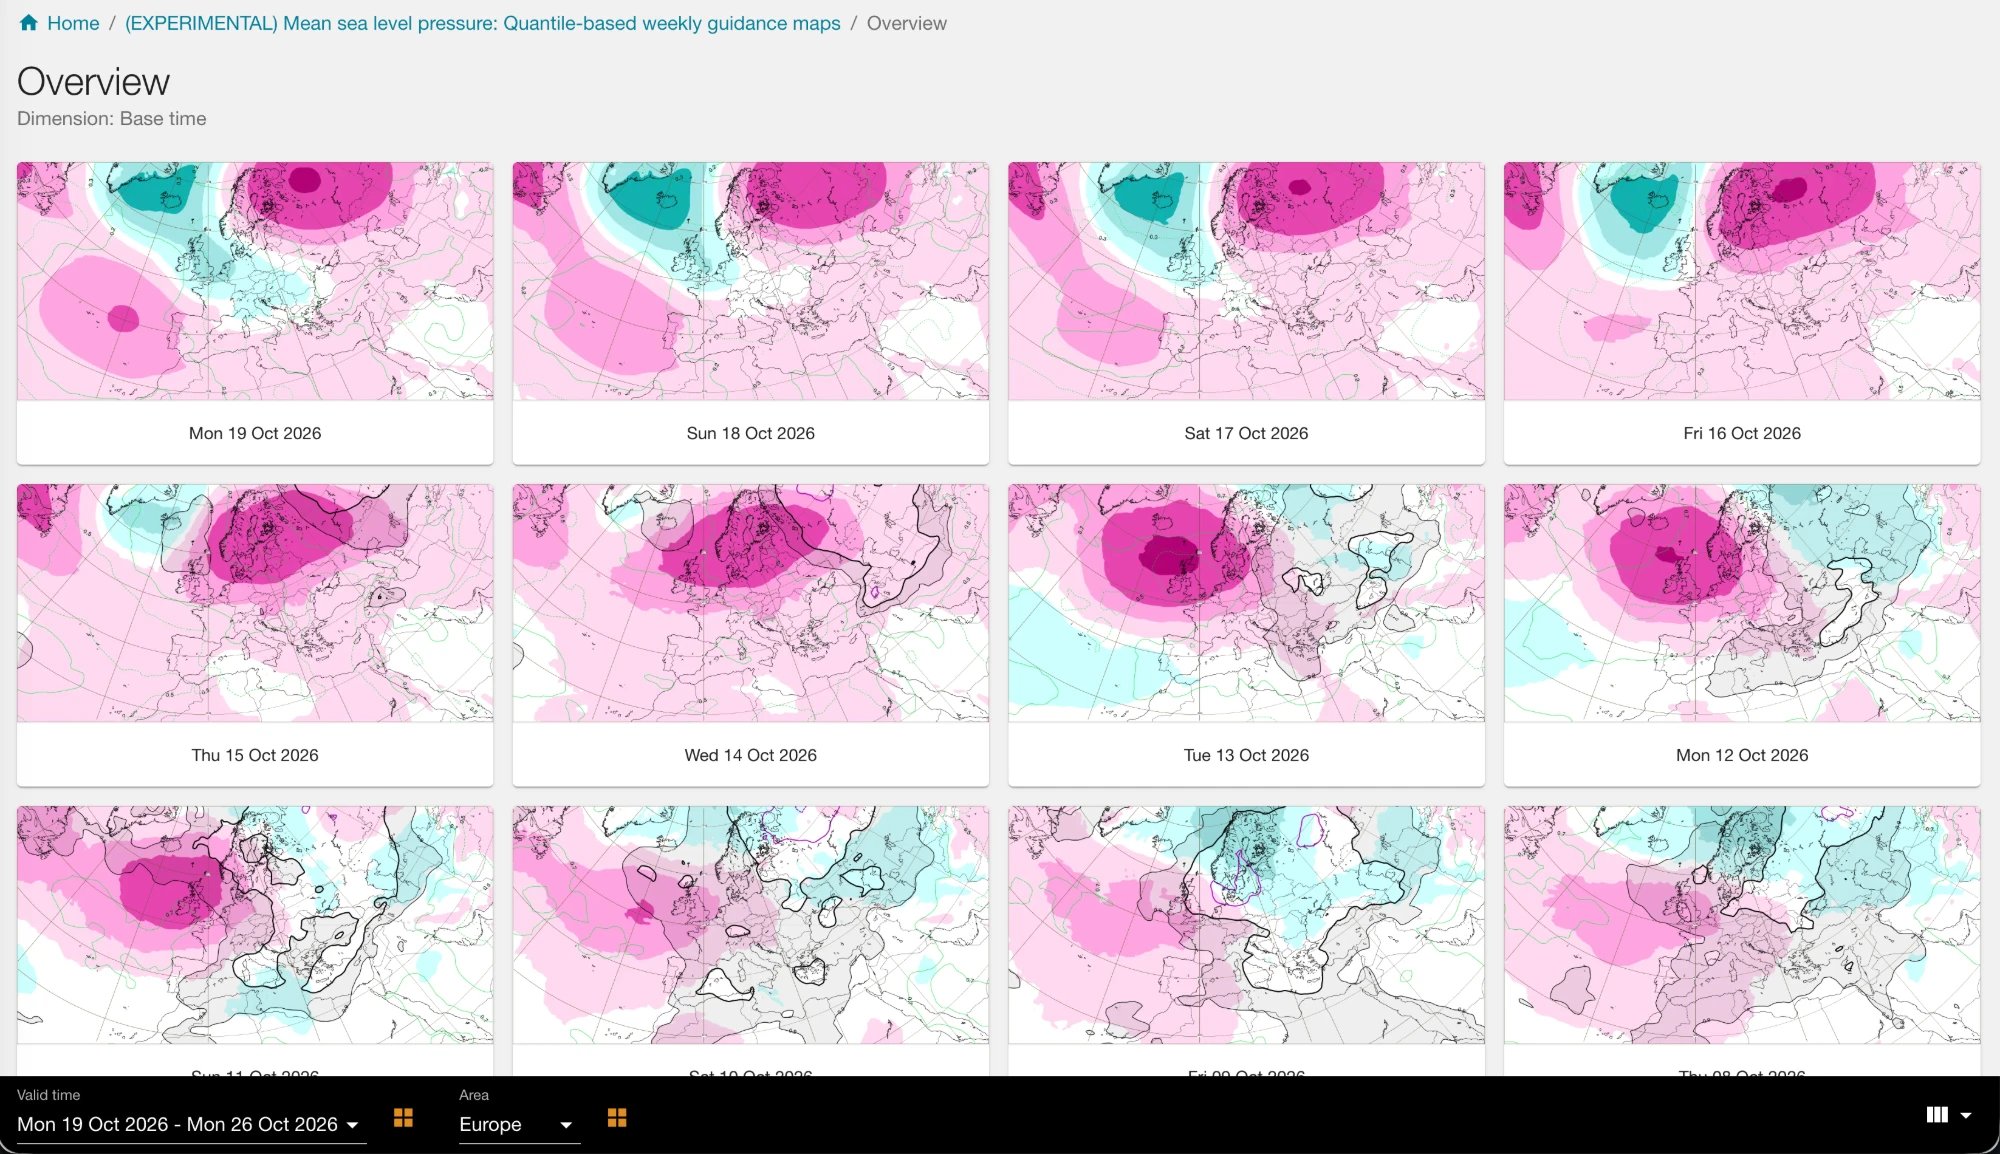
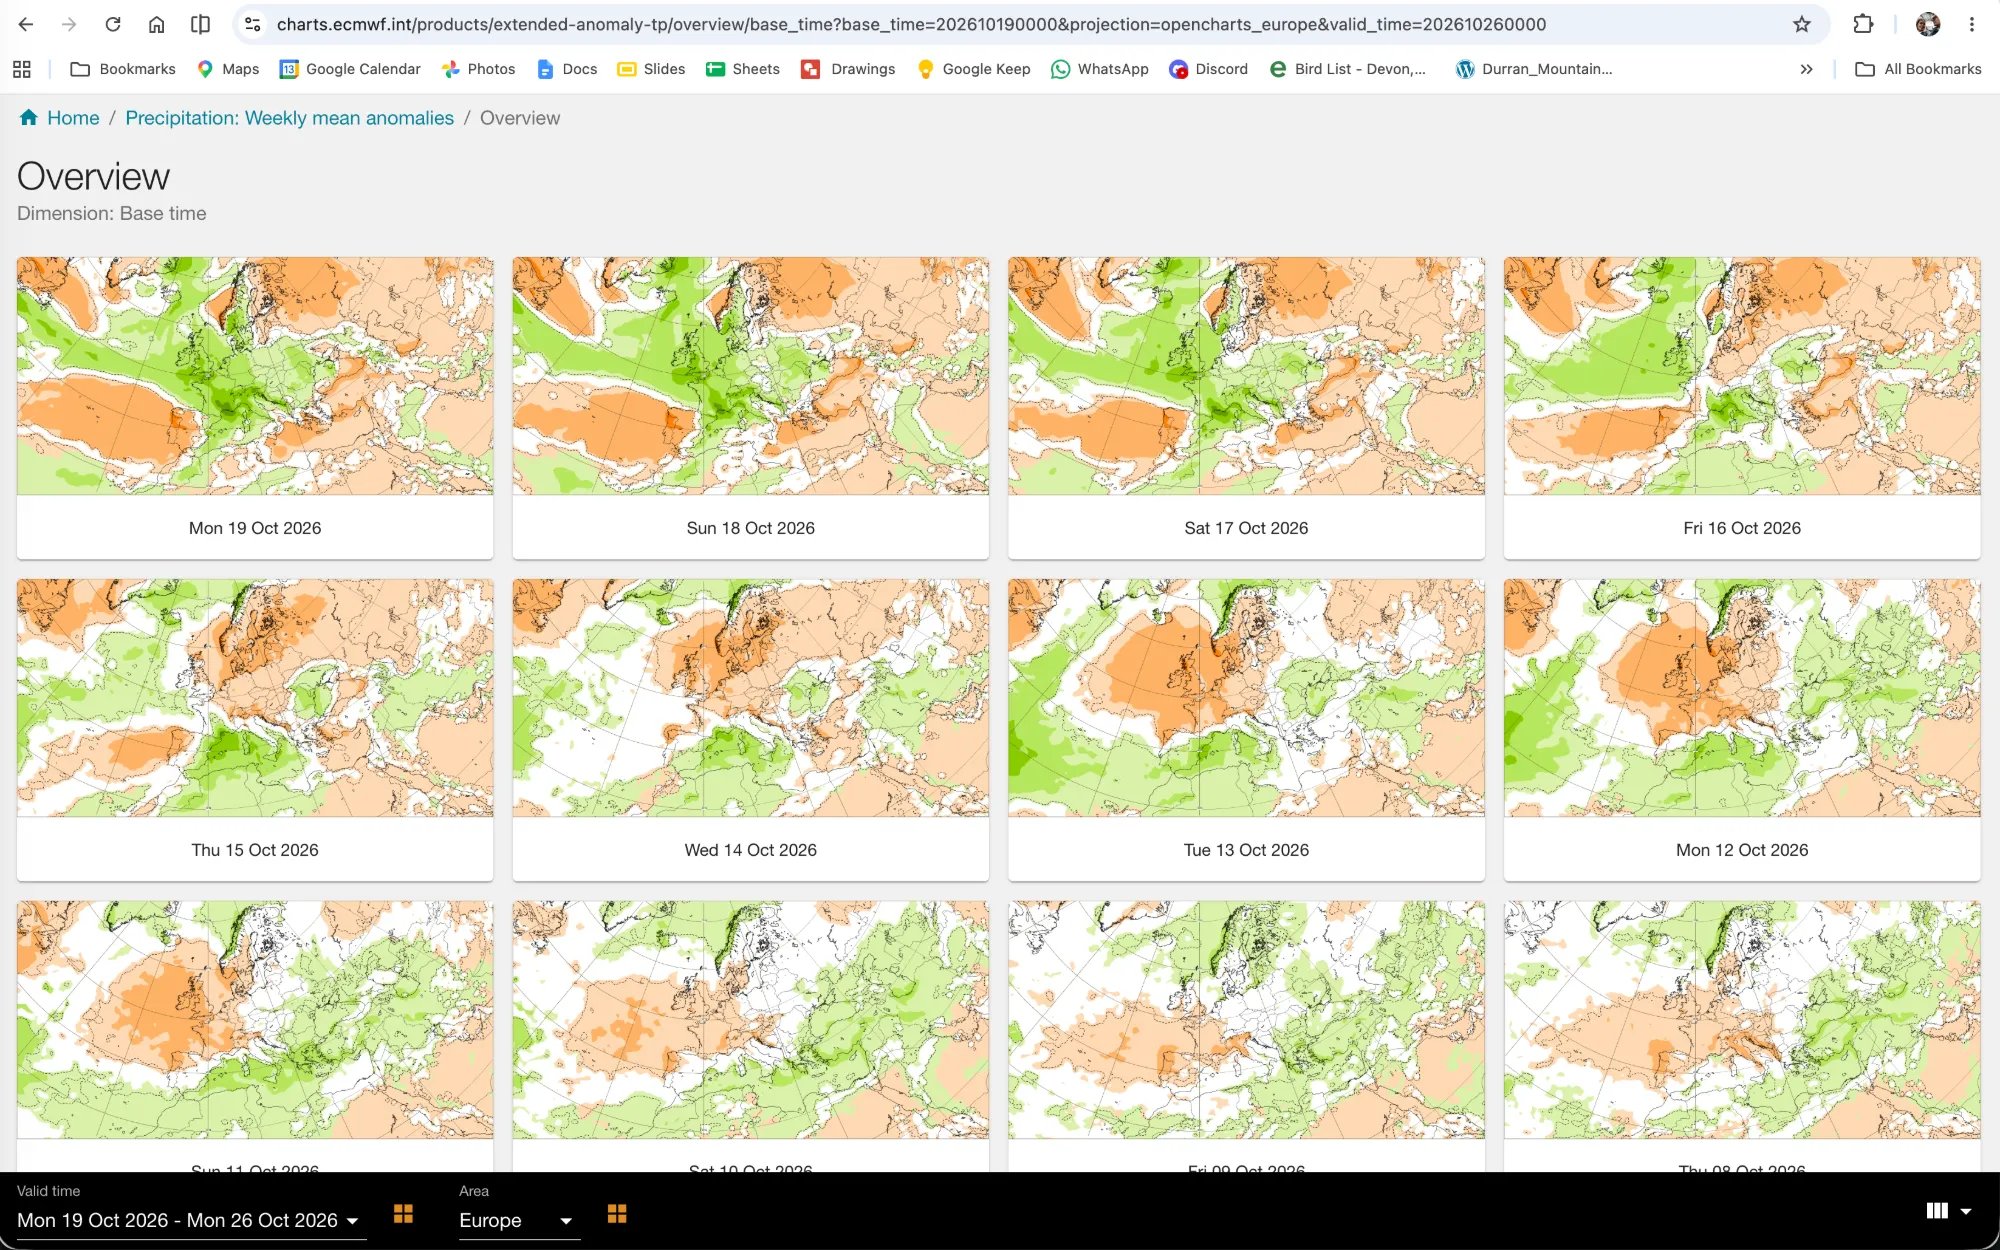
The flip was right: the UK high collapsed on 20 October
Checked against ECMWF analyses up to 21 Oct 00z.
Established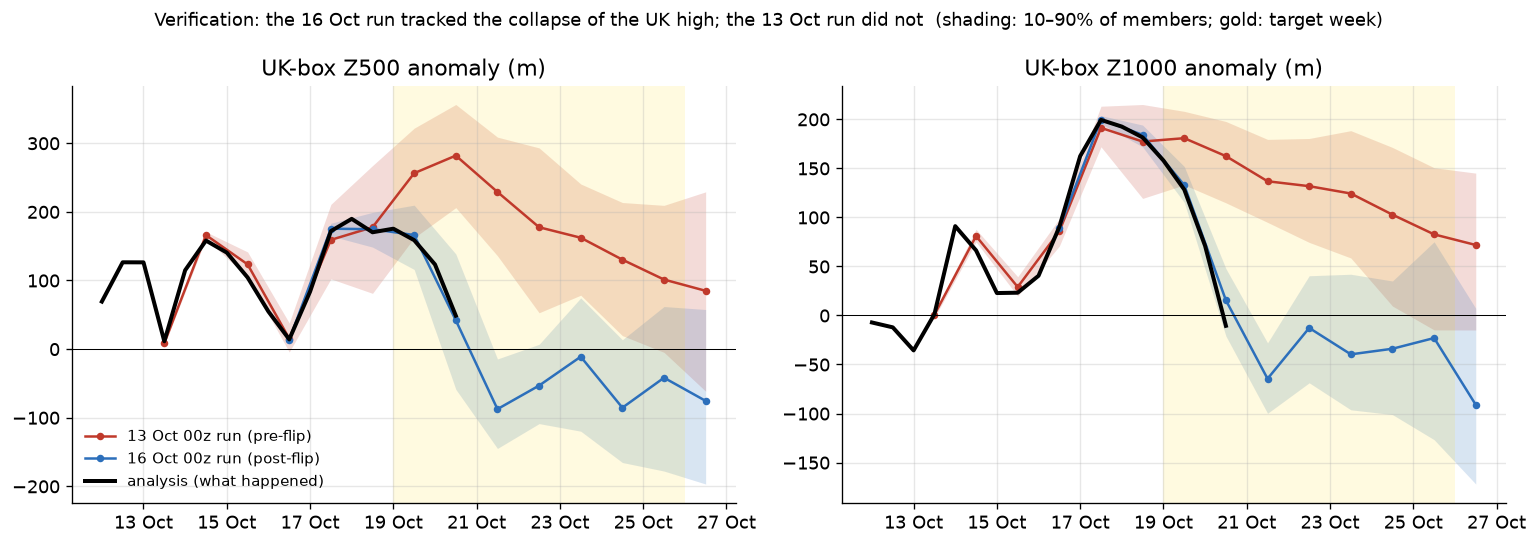
UK box, 12 UTC
| Analysis | 13 Oct run | 16 Oct run | |
|---|---|---|---|
| Z500, 19 Oct | 5713 m | 5811 | 5721 |
| Z500, 20 Oct | 5601 m | 5834 | 5594 |
| Z1000, 19 Oct | 222 m | 275 | 227 |
| Z1000, 20 Oct | 83 m | 256 | 109 |
Z1000 of 222 m is roughly 1028 hPa; 83 m is roughly 1010 hPa.
The early runs built a Greenland/Iceland block that never happened
The error is a dipole: heights far too high near Iceland and too low off Nova Scotia.
Established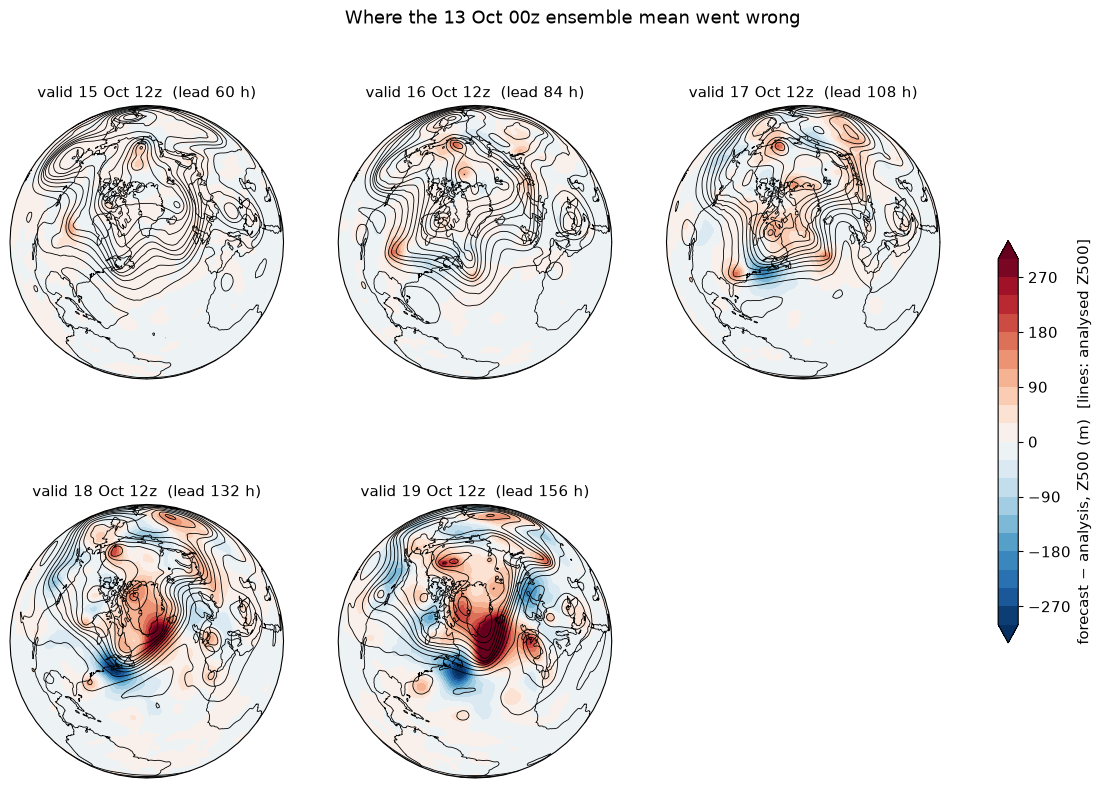
How big, and where first
- By 18–19 Oct: +380 to +500 m too high near 60°N, 33°W and −230 to −310 m too low near 40–43°N, 55–64°W.
- Observed Iceland-minus-SW-Atlantic height difference on 19 Oct: −192 m. The 13 Oct run's 10th percentile was −26 m, so essentially no member got there.
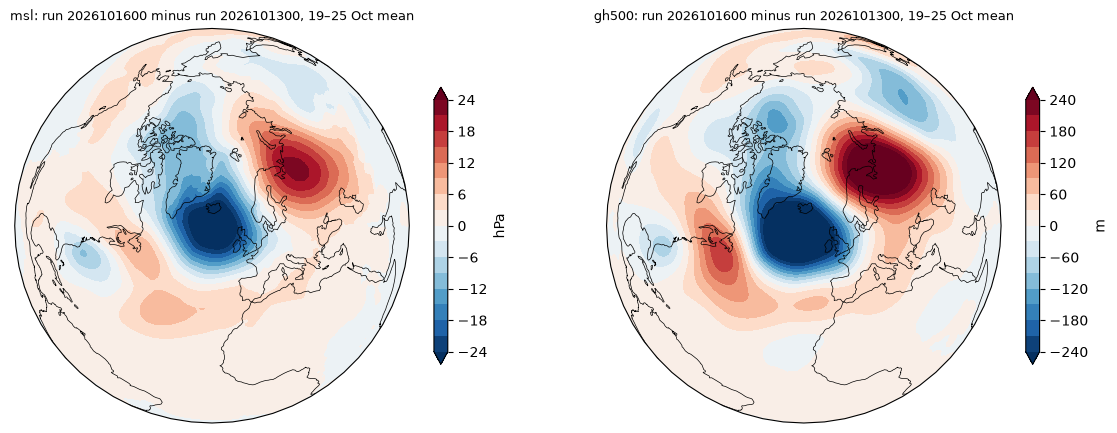
- 16 Oct run minus 13 Oct run: down to −32 hPa / −420 m south-west of Iceland, up to +22 hPa / +360 m over northern Scandinavia and north-west Russia.
| 13 Oct run, Z500 RMS error (m), 35–70°N | N America | Atlantic | Europe |
|---|---|---|---|
| 15 Oct (+60 h) | 20 | 11 | 8 |
| 16 Oct (+84 h) | 33 | 19 | 17 |
| 17 Oct (+108 h) | 43 | 51 | 22 |
| 18 Oct (+132 h) | 42 | 116 | 39 |
| 19 Oct (+156 h) | 48 | 180 | 63 |
| 20 Oct (+180 h) | 69 | 205 | 160 |
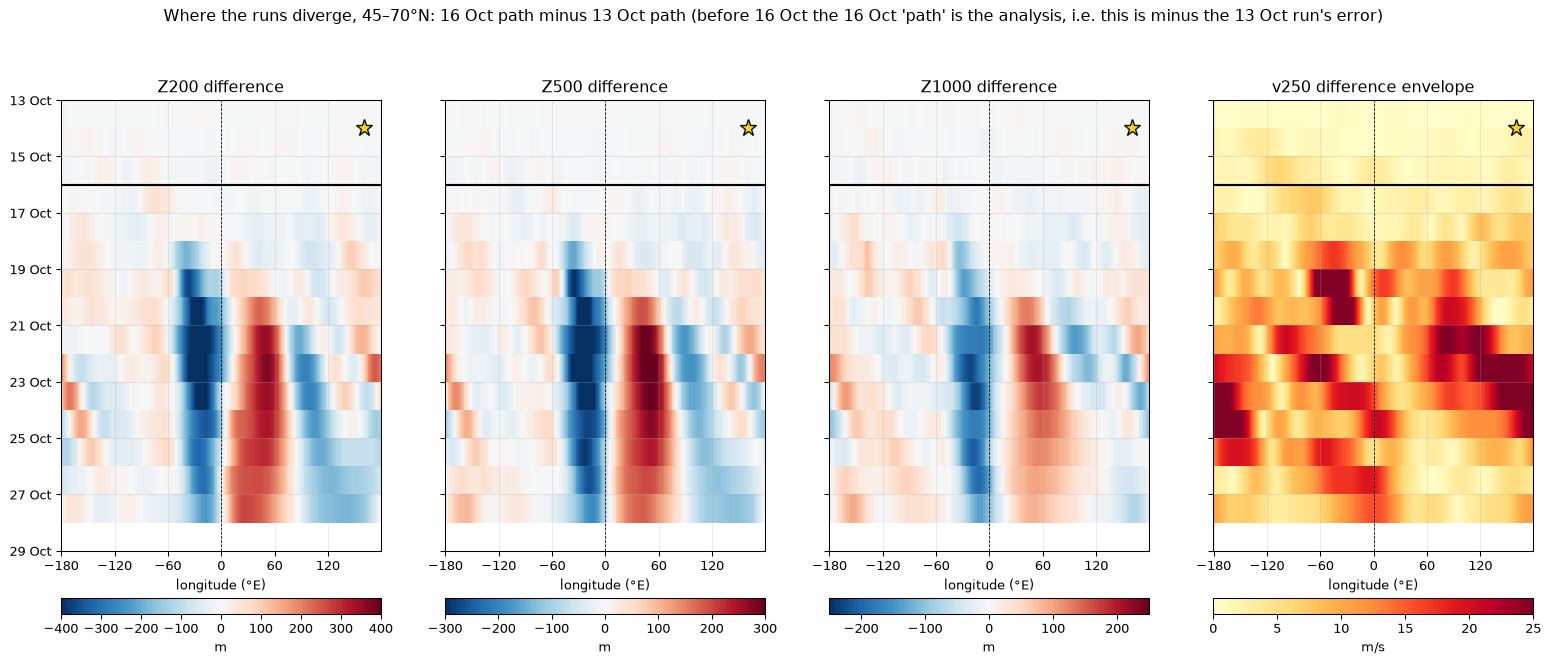
Show the overall difference maps and the "where the runs diverge" Hovmöller
A Rossby wave packet weakened over North America, but not in the forecast
The same packet, forecast correctly over the Pacific, stayed far too strong once it reached eastern North America.
Established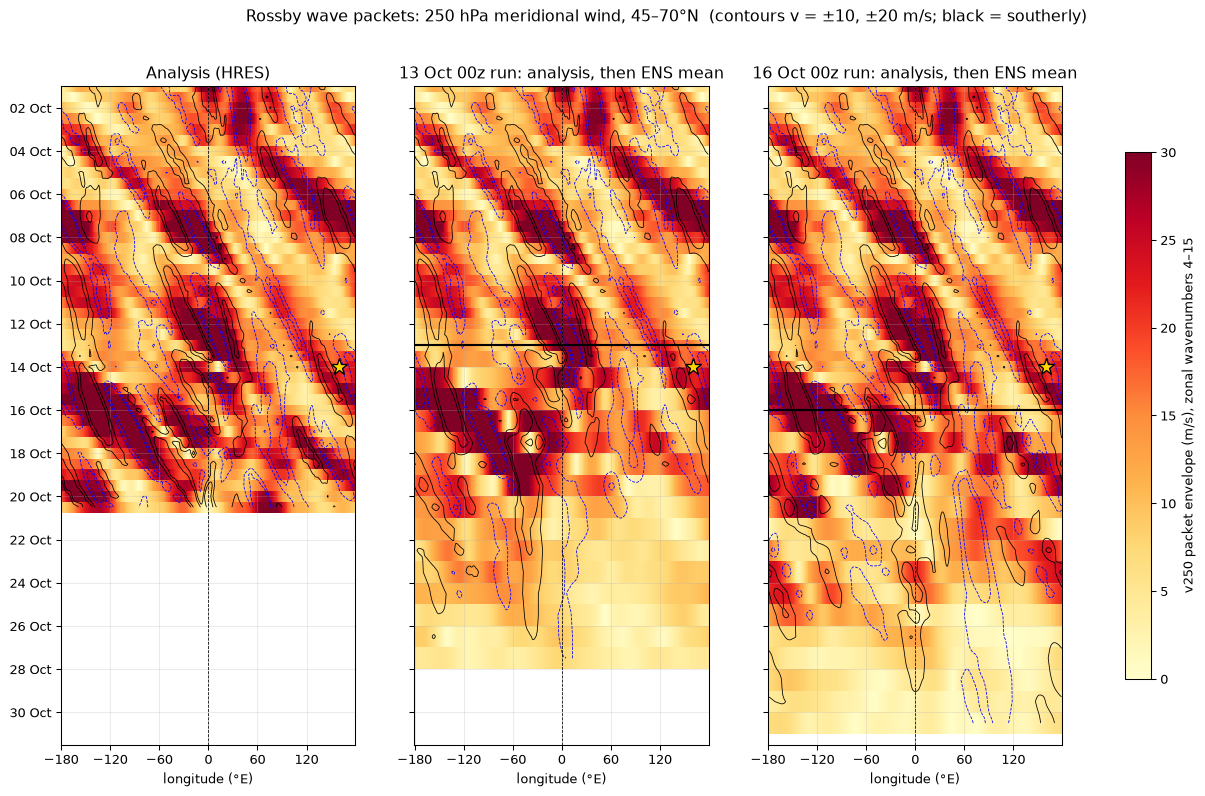
How to read a Hovmöller for packets
- Individual troughs and ridges move east slowly; here the phase speed is about 7–8 m/s.
- Energy moves along the packet at the group speed, here about 25 m/s, building new troughs and ridges downstream.
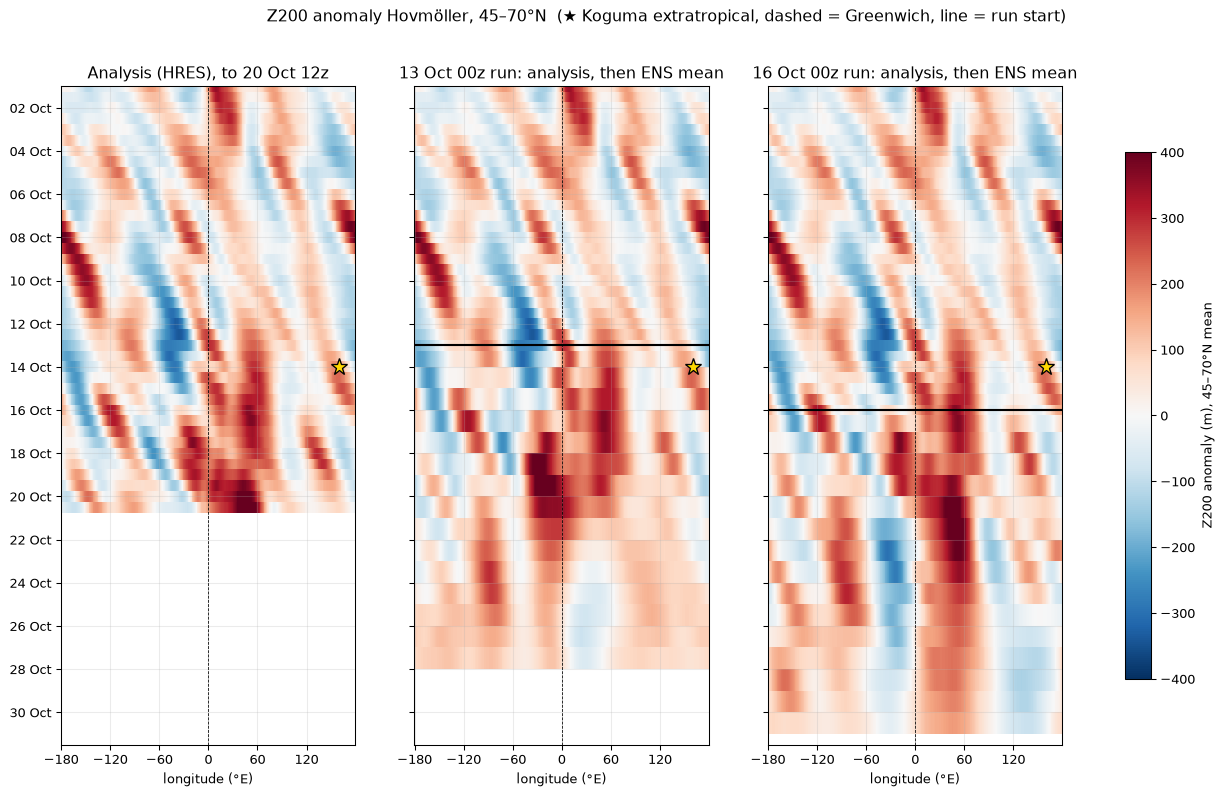
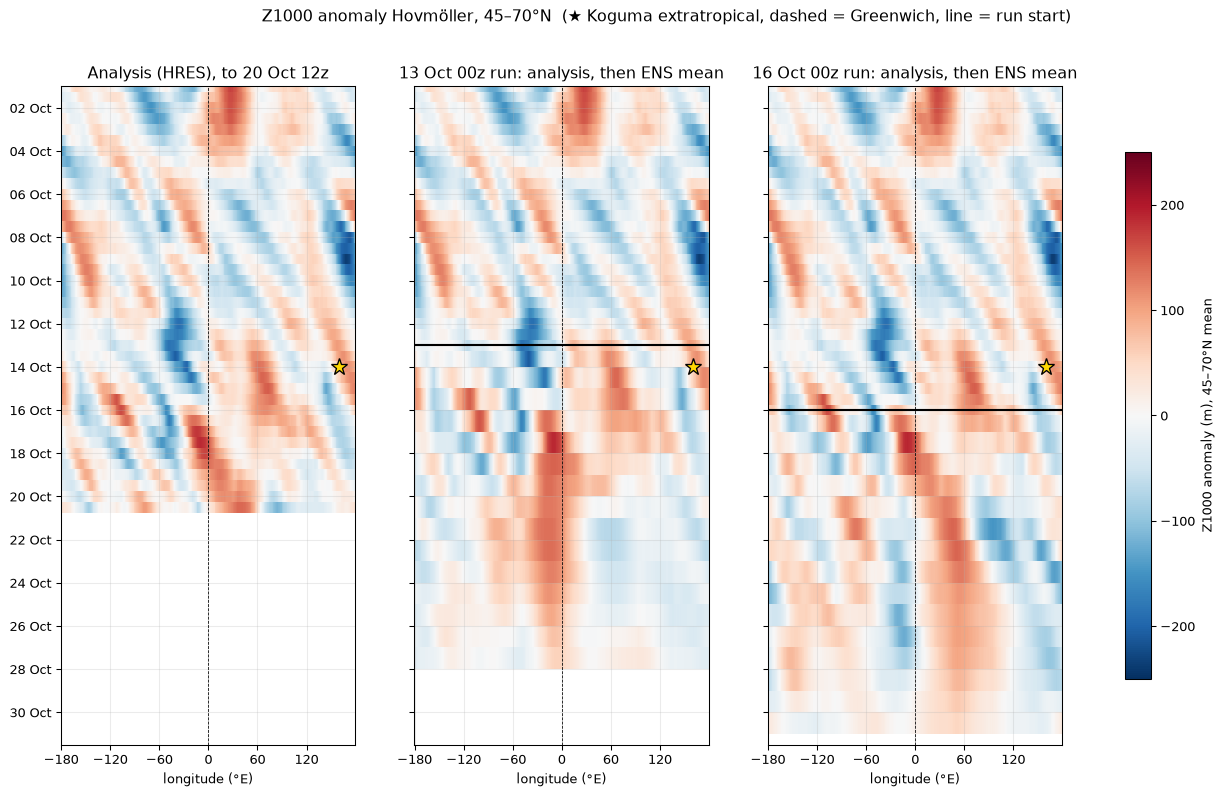
- In a Z Hovmöller that looks like a stepped, diagonal band of strong anomalies. The v250 envelope shows it as one band.
| Packet peak (35–60°N) | Analysis | 13 Oct run, member mean |
|---|---|---|
| 14 Oct, ~162°W | 42 m/s | 42 |
| 15 Oct, ~146°W | 42 | 43 |
| 16 Oct, ~140°W | 35 | 37 |
| 17 Oct, ~83°W | 38 | 44 |
| 18 Oct, ~71°W | 27 | 48 (10–90%: 43–54) |
| 19 Oct, ~14°W | 22 | 26 |
The packet started near 170°E on 13 Oct, peaked at 45 m/s near 152°W on 15 Oct and reached the UK on 19 Oct.
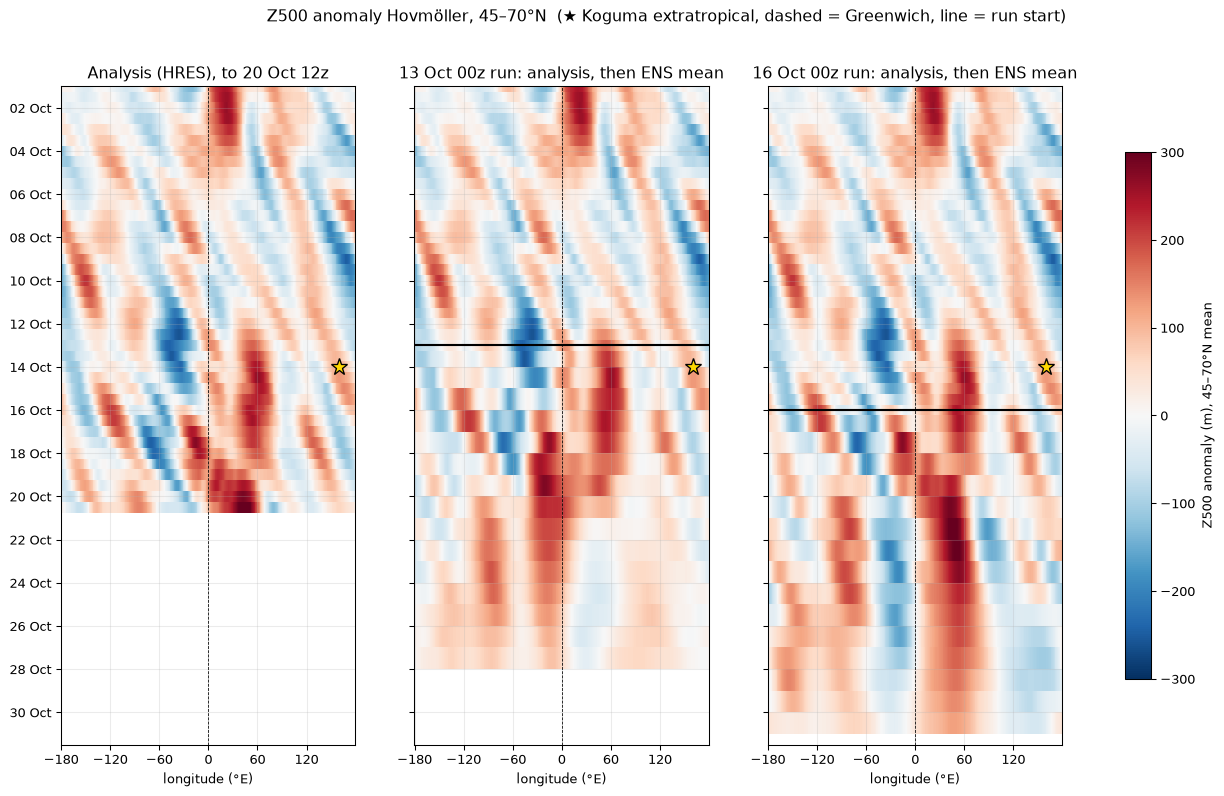
Show Z200 and Z1000 Hovmöllers
The trough dug further south, then split and lifted out
Why the packet weakened: the trough broke up instead of staying whole.
Established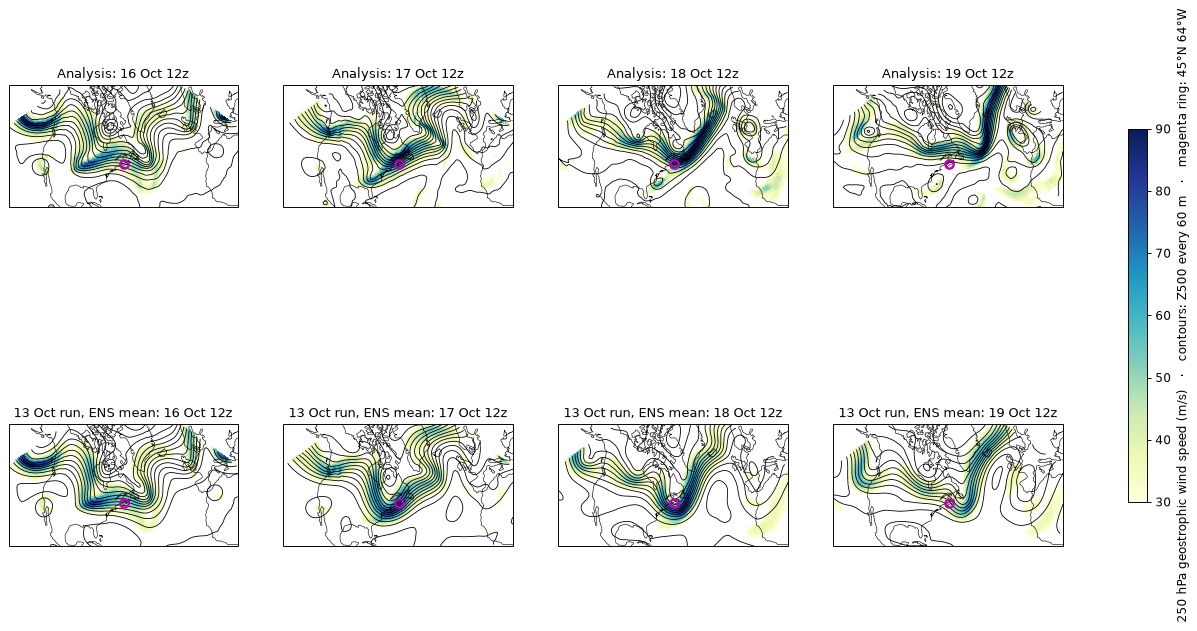
Trough along 75–90°W
| Analysis | 13 Oct run | |
|---|---|---|
| 17 Oct: reaches south to | 36°N | 39°N (10–90%: 37–40°N; 4 of 50 members reach 36°N) |
| 17 Oct: deepest Z500 | 5039 m | 5097 m (no member deeper than 5039 m) |
| 18 Oct: reaches south to | gone (north of 49°N) | 45°N (42–47°N) |
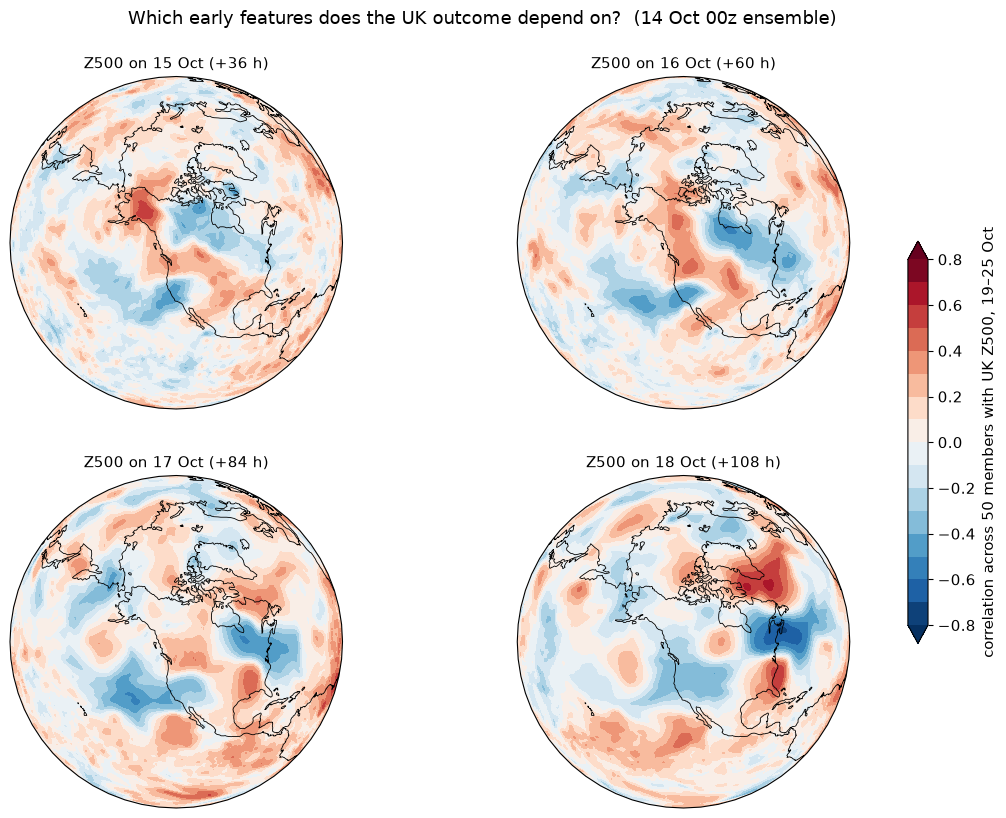
Does the UK outcome depend on this? (14 Oct run, members split)
- Z500 at 45°N, 64°W on 18 Oct: r = −0.73. A trough parked there means a UK high.
- Packet strength over 90–50°W on 18 Oct: r = +0.65. A stronger packet means a UK high.
- A shuffle test puts the 5% significance threshold at about |r| = 0.28 for a single pre-chosen box, and 0.56 for the strongest point anywhere in the hemisphere. Both values clear both.
Show the hemispheric sensitivity maps (14 Oct run)
Convection: the rain band followed the trough, but did not drive it
Underplayed in the 13 Oct run because its trough was in the wrong place. A latent-heating test on the 14 Oct members finds no sign that the heating deepened the short wave.
Tested · a sign, not a driver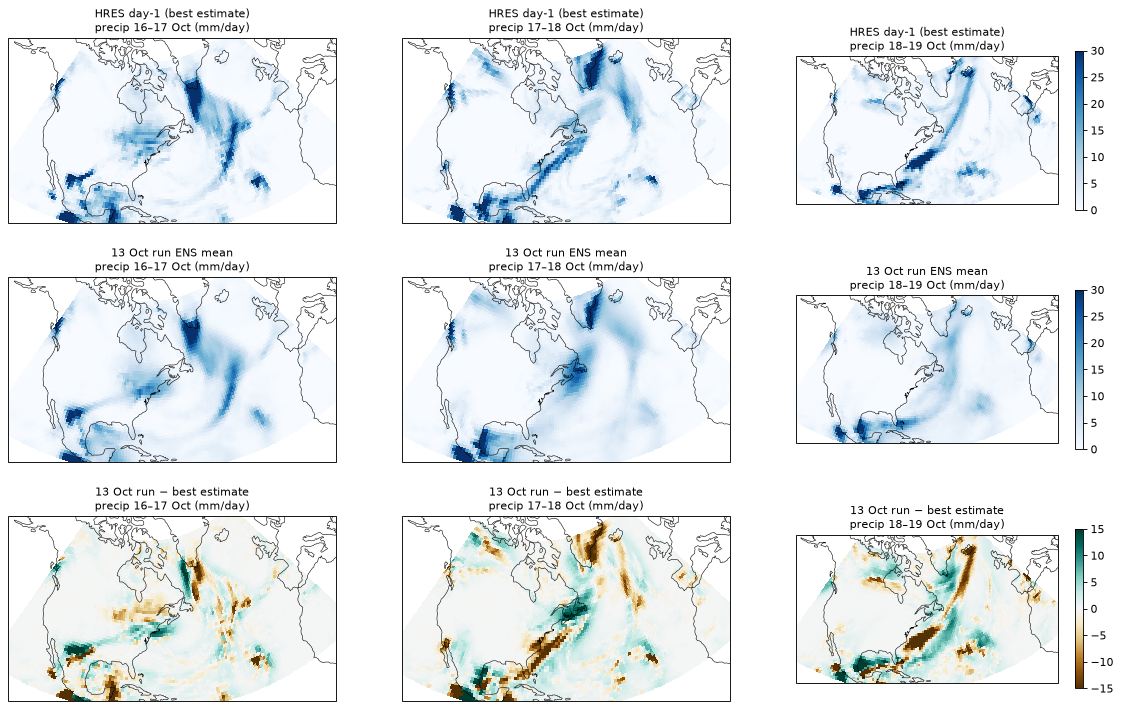
Box means (mm/day): best estimate · 13 Oct run · 16 Oct run
| Region, window | Best | 13 Oct | 16 Oct |
|---|---|---|---|
| SE US / Gulf, 17–18 Oct | 6.0 | 3.5 | 6.4 |
| US east coast + NW Atlantic, 18–19 Oct | 6.4 | 2.7 | 7.2 |
| US east coast + NW Atlantic, 16–17 Oct | 4.1 | 4.7 | 4.2 |
250 hPa outflow on 18 Oct 00z was about 30% weaker in the 13 Oct run: 6.1 against 9.4 (SE US) and 8.9 against 12.1 (east coast), in 10⁻⁶ s⁻¹.
- A fingerprint of the trough (14 Oct members): a coastal rain band on 18–19 Oct goes with the flip (r = −0.52); rain concentrated over the Maritimes on 17–18 Oct goes with the block (r = +0.55).
- Timing points to the trough first: the 13 Oct run's height errors over North America were already growing on 15–16 Oct, while its rainfall was still about right on 16–17 Oct.
Latent-heating test, 14 Oct run (50 members)
| Test | Result |
|---|---|
| Rain ahead of each member's short wave → its next deepening, allowing for the wave's strength and latitude | partial r −0.08 to +0.10: none |
| Gulf / SE US moisture and CAPE on 15–16 Oct, before the wave arrived | |r| ≤ 0.18: none |
| Rain ahead of the real wave, 16 Oct (24 h) | 5.6 mm against a best estimate of 5.3 (38 of 50 members at or above): not underdone, yet wave strength on 17 Oct 12z was 22.9 against 28.4 |
| 700 hPa ascent ahead of the trough → UK week | r +0.30 to +0.47; +0.32 to +0.40 after allowing for the wave: favours the block |
| 700 hPa ascent ahead of the trough → the wave's next deepening | r −0.15 to −0.43: slightly less deepening |
"Ahead" = the downstream half of a disc around each member's wave; results hold for radii of 1,000, 1,500 and 2,000 km and for both 12 h windows tested. Shuffle-test 5% threshold about |r| = 0.28.
Origin: a short wave that came ashore in British Columbia, then dug further south and deeper than forecast
Traced as a 500 hPa vorticity maximum in 6-hourly analyses, then followed in every ensemble member.
Traced · two-step forecast error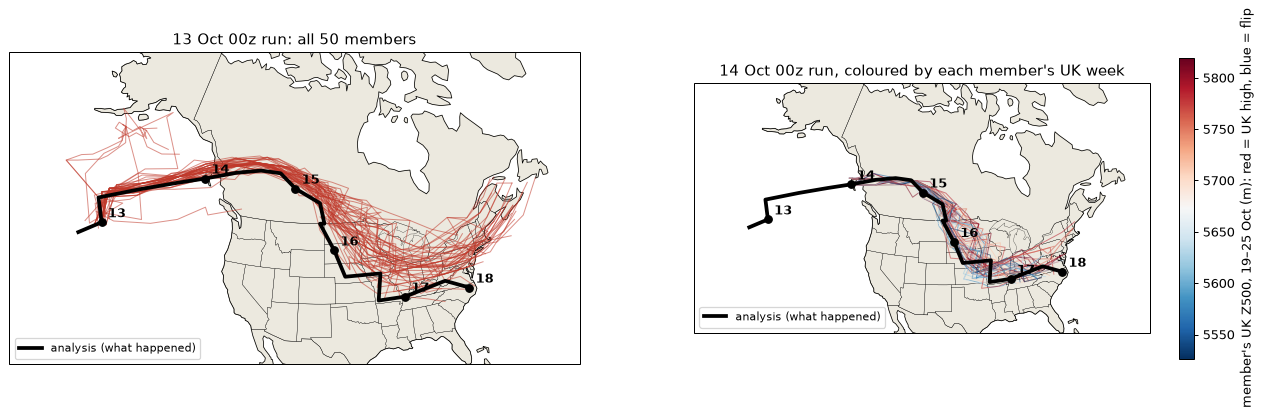
The real track
- 13 Oct: a weak feature in the NE Pacific (44°N, 153°W) strengthens through the Gulf of Alaska.
- 14 Oct: comes ashore on the BC coast (53°N, 133°W at 00z) and crosses the Rockies into north-east BC and Alberta.
- 15 Oct: turns south-east over Saskatchewan (49°N, 104°W at 12z).
- 16 Oct: digs through the Dakotas, Iowa and Missouri.
- 17–18 Oct: reaches Tennessee and North Carolina (36–38°N), strengthening from about 14 to 28 ×10⁻⁵ s⁻¹. This is the trough of frame 5.
Before 13 Oct the trace leads back, tentatively, to an upper low north-east of Hawaii (26–29°N, 165–170°W) on 10–11 Oct. The feature nearly vanished on 12 Oct, so that link is uncertain.
Step 1 · 13 Oct run: right for two days, then the wrong track
| Valid (lead) | Real | Members (mean) | Error |
|---|---|---|---|
| 15 Oct 00z (+48 h) | 54°N 111°W | 55.1°N 112.5°W | 230 km |
| 15 Oct 12z (+60 h) | 49°N 104°W | 51.9°N 106.2°W | 420 km |
| 16 Oct 06z (+78 h) | 41°N 100°W | 45.4°N 98.1°W | 660 km |
| 17 Oct 00z (+96 h) | 37°N 89°W | 41.7°N 85.3°W | 890 km |
| 17 Oct 12z (+108 h) | 38°N 81°W | 44.1°N 74.6°W | 1,450 km |
Within 110–230 km up to 15 Oct 00z. After the Rockies crossing the forecast wave stays 3–6° too far north and lifts out north-east. The error sits on the wave and the ridge immediately behind it (frame 8).
Step 2 · 14 Oct run: right track, not deep enough
- Its members follow the real path closely (16 Oct 00z: 45.8°N against a real 45°N).
- At the trough base on 17 Oct 12z they average 22.9 against a real 28.4 ×10⁻⁵ s⁻¹; only one member reaches 29.1.
| 14 Oct members, wave strength on 17 Oct 12z | UK Z500, 19–25 Oct |
|---|---|
| Stronger half | 5648 m (the flip) |
| Weaker half | 5736 m (the high) |
r = −0.50 between strength and the UK week (5% threshold about 0.27). The latent-heating test in frame 6 finds no sign that rain drove this deepening, so the missing strength looks dynamical: the upper-level jet and wave structure, which 1° open-data fields cannot resolve well.
Why the flip was gradual
- 13 Oct and earlier: wrong track → no dig → Greenland block → dry UK.
- 14 Oct: right track, too weak → partial flip (UK +10 → +5 hPa).
- 16–17 Oct: the dug, deepened wave is in the analysis itself → full flip.
Show the regional height errors (13 Oct run)
| Valid | Canadian Prairies 45–58°N 115–95°W | Central US 32–45°N 105–85°W | SE US 25–35°N 90–75°W |
|---|---|---|---|
| 14 Oct (+36 h) | +4 | +1 | −2 |
| 15 Oct (+60 h) | +27 | +12 | −1 |
| 16 Oct (+84 h) | +21 | +44 | −2 |
| 17 Oct (+108 h) | +9 | +17 | +21 |
Mean Z500 error in metres; positive means forecast heights too high, so the trough is too weak or misplaced. The error moves south-east with the short wave.
Observations and steering: why the short wave turned south
The wave reached the radiosonde network only at landfall. The 13 Oct run was close then; the error grew over land as the ridge right behind the wave sharpened more than forecast.
Supported · about half the track error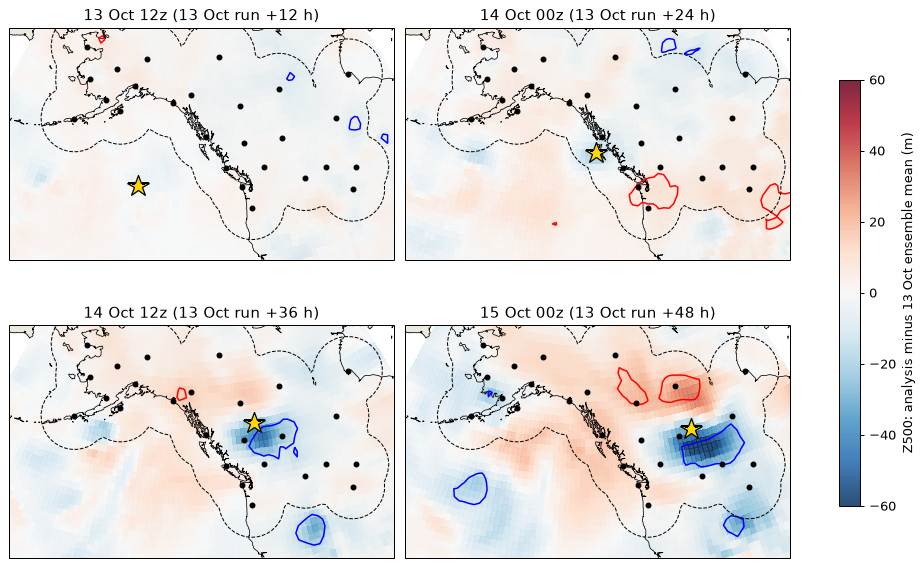
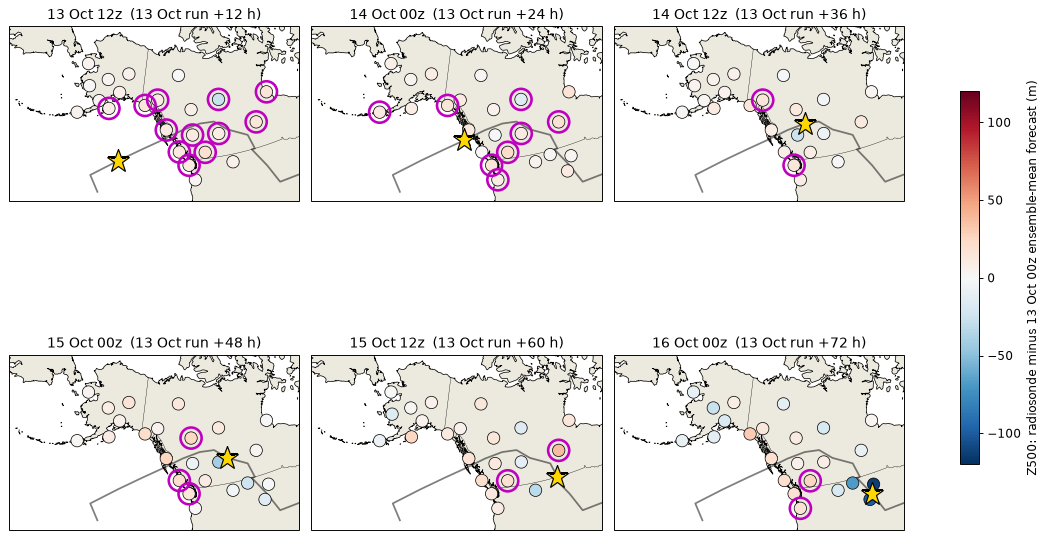
When the balloons first saw the wave
| Time | Wave | Nearest radiosonde | Stations ≤800 km |
|---|---|---|---|
| 13 Oct 00z | 41°N 150°W | Cold Bay, 1,833 km | 0 |
| 13 Oct 12z | 48°N 146°W | Kodiak, 1,166 km | 0 |
| 14 Oct 00z | 53°N 133°W | Annette Island, 245 km | 3 |
| 14 Oct 12z | 56°N 120°W | Prince George, 294 km | 7 |
Analysis minus 13 Oct forecast, on the wave
- 14 Oct 00z (landfall, +24 h): largest difference −25 m, on the wave; within the ensemble spread almost everywhere.
- 14 Oct 12z: −50 m at 54°N 118°W. 15 Oct 00z: −66 m at 51°N 109°W, with 20% of nearby points beyond two spreads.
- Balloons then recorded the gap: Stony Plain −41 m below the 13 Oct forecast (15 Oct), Rapid City −100 m and Bismarck −114 m (16 Oct), at or below the lowest members.
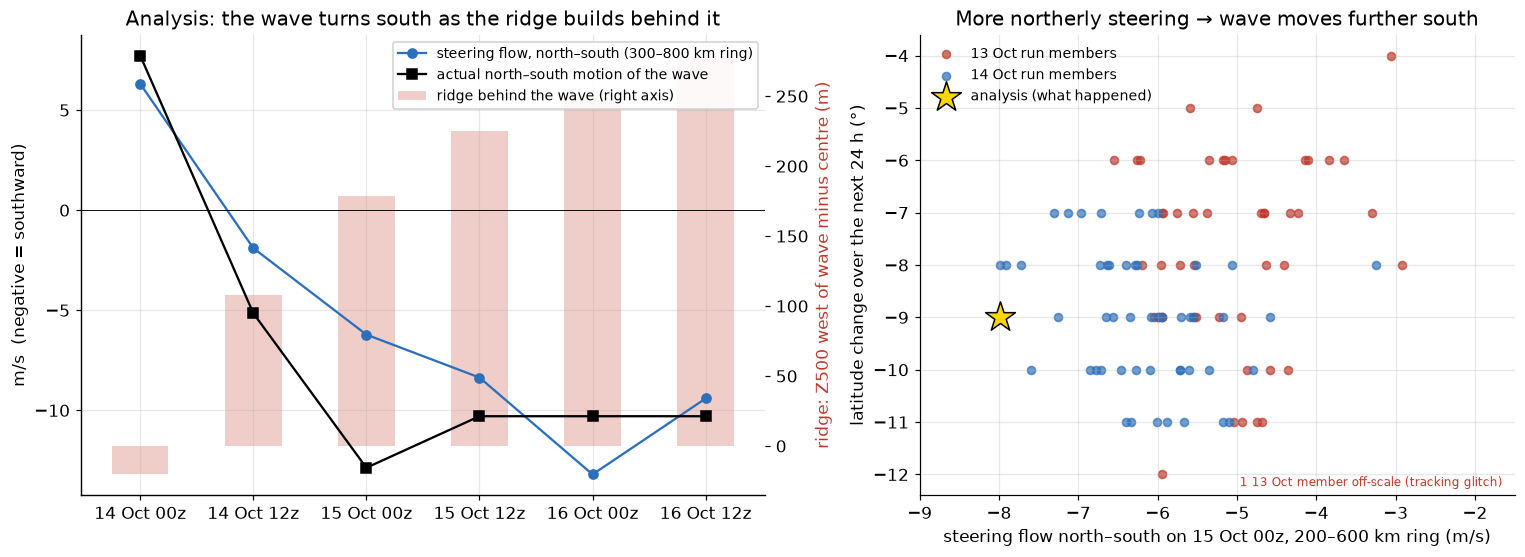
The mechanism in the 13 Oct members
- Stronger ridge behind the wave → stronger northerly steering: r = −0.43 to −0.68.
- Stronger northerly steering → further south 24 h later, allowing for starting latitude: partial r +0.39 to +0.68; +0.44 to +0.81 across three ring sizes.
- The run's ridge was 8–20 m weaker than analysed and its steering 0.5–3 m/s less northerly. The 14 Oct run had both about right, and its track was right.
- Balloons on 15 Oct 12z: 250 hPa northerlies of −52 m/s at Stony Plain and −47 m/s at Great Falls, against −44 and −38 m/s in the 13 Oct forecast.
The missing northerlies were close to the wave
| Steering on 15 Oct 00z | 13 Oct members | Analysis | Members as northerly |
|---|---|---|---|
| 200–600 km ring | −4.7 m/s | −8.0 m/s | 0 of 50 |
| 300–800 km ring | −5.0 | −6.2 | 4 of 50 |
| 400–1,000 km ring | −5.1 | −5.1 | 36 of 50 |
Show balloon-minus-forecast at each station
The Four Corners upper low: a phasing partner, not the source of the error
Hypothesis raised by Nick Silkstone from the ERA5 500 hPa map for 14 Oct 21 UTC: did this small upper low give the northern trough lower heights to drop into?
Real and relevant · not the error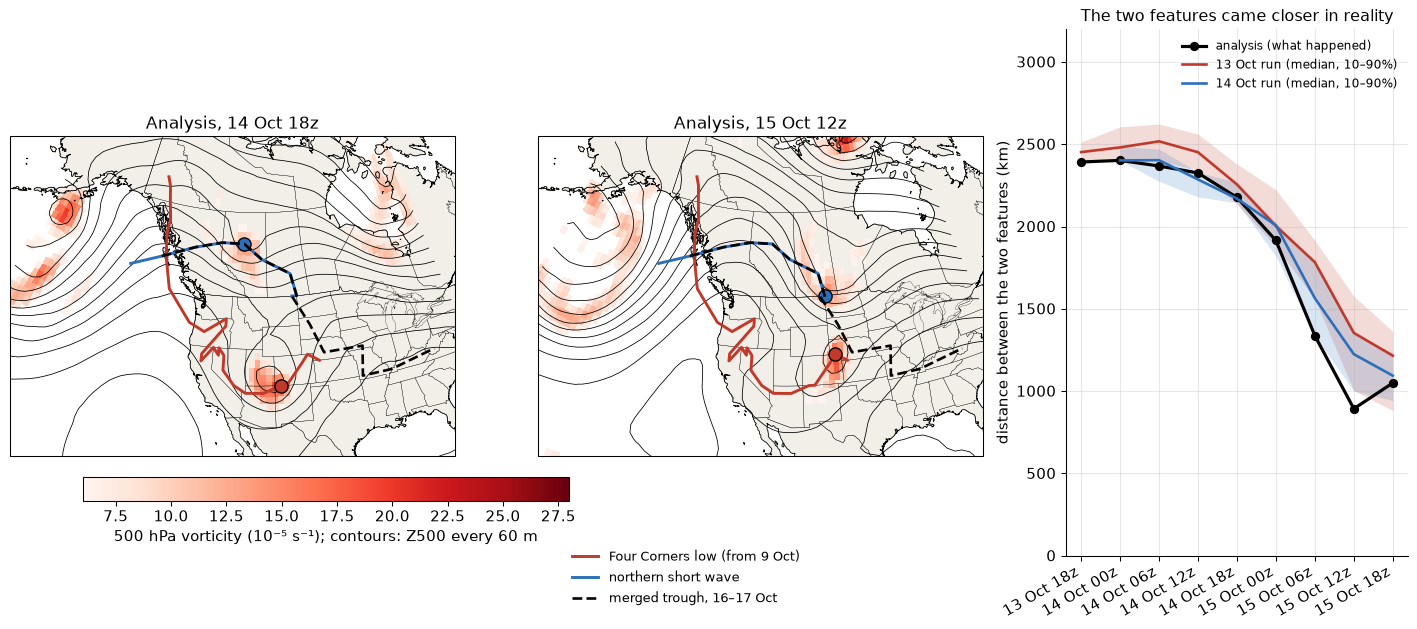
What the low was
- A cut-off low from the north, not the subtropics: a short wave over the Yukon and SE Alaska on 9 Oct that dropped down the BC and Oregon coast (10–11 Oct), cut off over the Great Basin (12–13 Oct), crossed Arizona and the Four Corners on 14 Oct and reached Colorado and Nebraska on 15 Oct.
- Compact and strong: vorticity about 25 ×10⁻⁵ s⁻¹, closed 500 hPa low near 5,620 m on 14 Oct.
- It phased with the northern wave: the gap closed from 2,400 km (14 Oct) to 893 km (15 Oct 12z); one merged feature by 16 Oct 06z, which then deepened from about 16 to 28 ×10⁻⁵ s⁻¹ as it dug into the south-east US. Phasing combines the two troughs' vorticity into one larger, deeper trough, which fits the trough extending further south.
Sensitivity tests across members
| Test | Result |
|---|---|
| The low in the 13 and 14 Oct forecasts, 14–15 Oct | Position within 0–178 km; lowest Z500 within 4–16 m; similar strength: well forecast |
| Its strength, depth and position on 15 Oct → later dig, trough reach, UK week | |r| ≤ 0.29: no significant link, though members varied about as much as in the northern wave's latitude, which did show links |
| Members bringing the two features within 1,000 km by 15 Oct 12z (real: 893 km) | 2 of 50 (13 Oct run), 4 of 50 (14 Oct run) |
| Closer half against further half of 14 Oct members: UK week Z500 | 5669 against 5715 m: right direction, not significant (r = +0.19) |
Cross-check: AIFS-ENS made the same mistake
ECMWF's machine-learnt ensemble, started from the same analyses, shows the same short-wave and trough errors and flipped no earlier.
Established · same error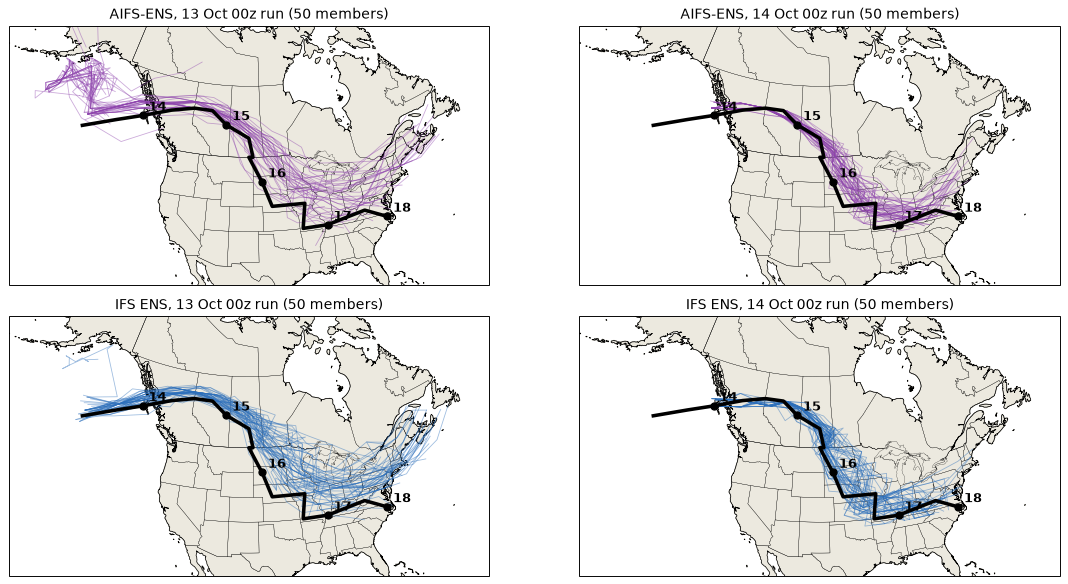
13 Oct 00z run: the short wave
| Valid | Real | AIFS (error) | IFS (error) | Strength AIFS / IFS |
|---|---|---|---|---|
| 15 Oct 12z | 49°N | 52.2°N (295 km) | 51.7°N (395 km) | 1.03 / 1.03 |
| 16 Oct 12z | 41°N | 46.5°N (671 km) | 42.6°N (333 km) | 0.92 / 1.08 |
| 17 Oct 00z | 37°N | 45.2°N (1,327 km) | 41.0°N (851 km) | 0.71 / 0.91 |
| 17 Oct 12z | 38°N | 45.8°N (1,748 km) | 43.6°N (1,375 km) | 0.73 / 0.79 |
Strength is relative to each method's own analysis value (1.00 = as analysed). Tracking starts at 13 Oct 12z for both systems, because at 13 Oct 00z the wave was too weak in height-derived vorticity to track.
- 14 Oct 00z run: both systems follow the real path (AIFS 111 km off on 15 Oct 12z, IFS 264 km), and both under-deepen the wave by 17 Oct 12z (0.79 and 0.80 of the analysed strength).
Trough, packet and verification
| Analysis | AIFS | IFS | |
|---|---|---|---|
| Trough reach along 75–90°W, 17 Oct 12z: 13 Oct run | 36°N | 38.8°N (4/50 reach 36°N) | 38.6°N (4/50) |
| Same, 14 Oct run | 36°N | 37.7°N (10/50) | 37.6°N (12/50) |
| Packet near 71°W, 18 Oct 12z: 13 Oct run | 27 m/s | 47 (10–90%: 38–56) | 48 (43–54) |
| Same, 14 Oct run | 27 m/s | 46 (30–57) | 40 (22–54) |
| UK-box Z500, 20 Oct 12z, from the 16 Oct run | 5601 m | 5641 | 5594 |
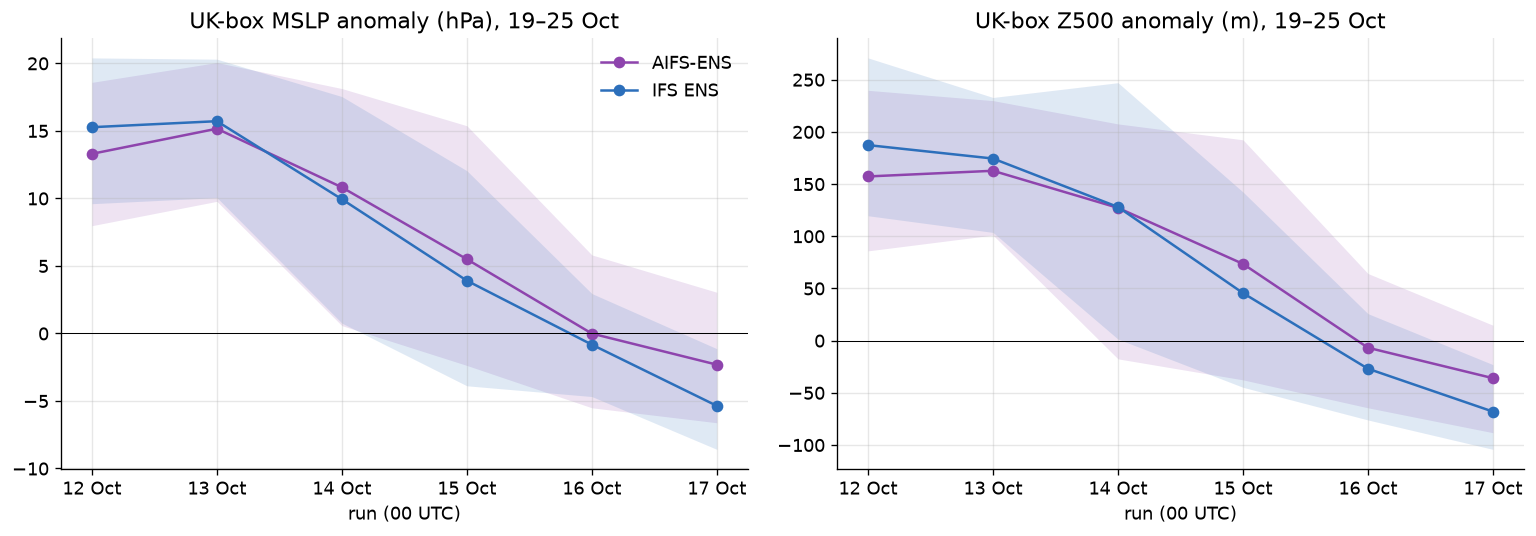
| Run (00z) | AIFS MSLP | IFS MSLP |
|---|---|---|
| 13 Oct | +15.2 (100% high) | +15.7 (100%) |
| 14 Oct | +10.8 (90%) | +9.9 (94%) |
| 15 Oct | +5.5 (82%) | +3.9 (70%) |
| 16 Oct | −0.0 (46%) | −0.8 (42%) |
| 17 Oct | −2.3 (26%) | −5.4 (6%) |
UK-box MSLP anomaly (hPa), 19–25 Oct, with the share of members above normal.
Typhoon Koguma: it seeded the packet, but it isn't where the forecast went wrong
Revised from the first storyboard.
Context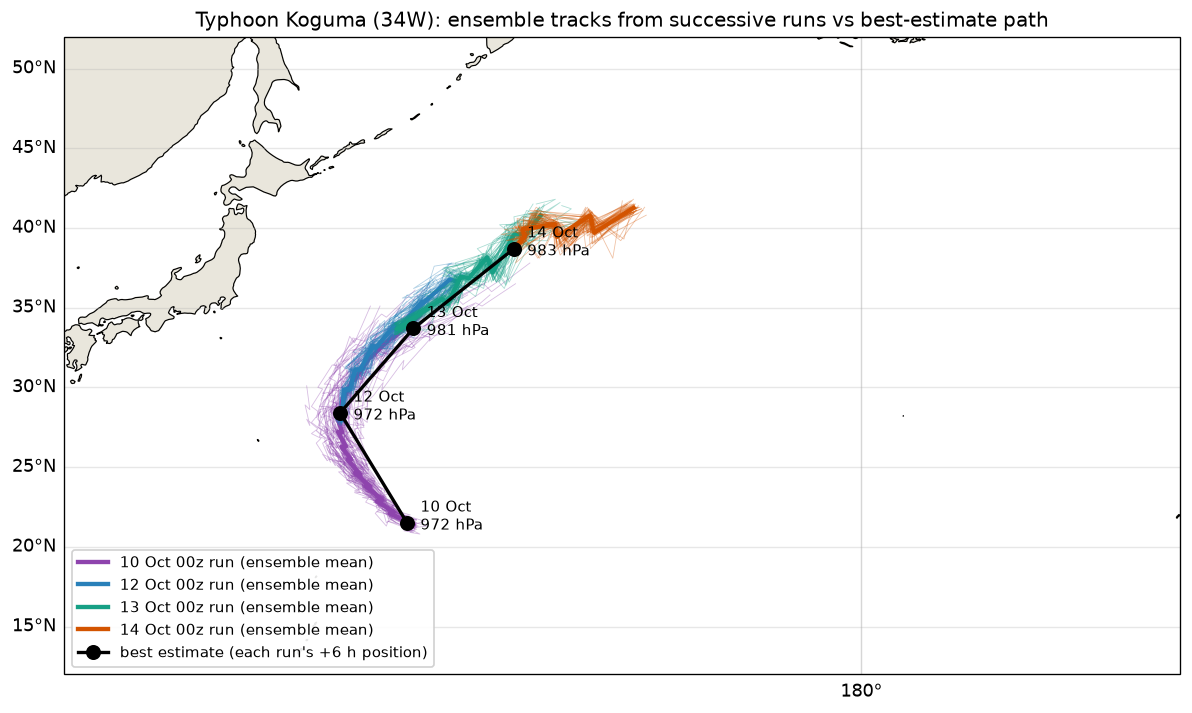
- Koguma recurved and went extratropical on about 14 Oct near 39°N, 158°E. The packet in frame 4 starts at that longitude and time.
- The early runs had its track too slow and too far south-west, by 550–1,630 km. Intensity error was small (−8 to +2 hPa on the ensemble mean).
- But the 13 Oct run forecast the resulting packet over the Pacific almost exactly (42/42, 43/42, 37/35 m/s on 14–16 Oct). The Gulf of Alaska low's depth was also right (973.6 against 975.2 hPa).
- So Koguma helped create the situation, but its forecast errors did not cause the flip.
Checked and ruled out
Tropical cyclones near North America Ruled out
- Atlantic / Caribbean: the only storm was Isaias (09L), at 976 hPa on the northern Gulf coast on 10 Oct. It was inland and decaying by 11 Oct. No run from 11 to 17 Oct tracks any Atlantic system.
- Eastern Pacific: Simon weakened off western Mexico; Trudy deepened to about 977 hPa off southern Mexico on 16–18 Oct and moved north-west along the coast. There is no sign either was involved.
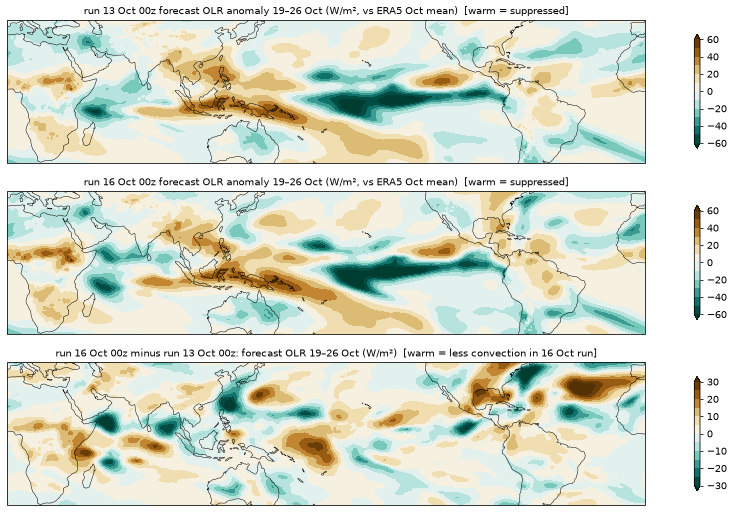
Tropical convection and MJO Ruled out as the trigger
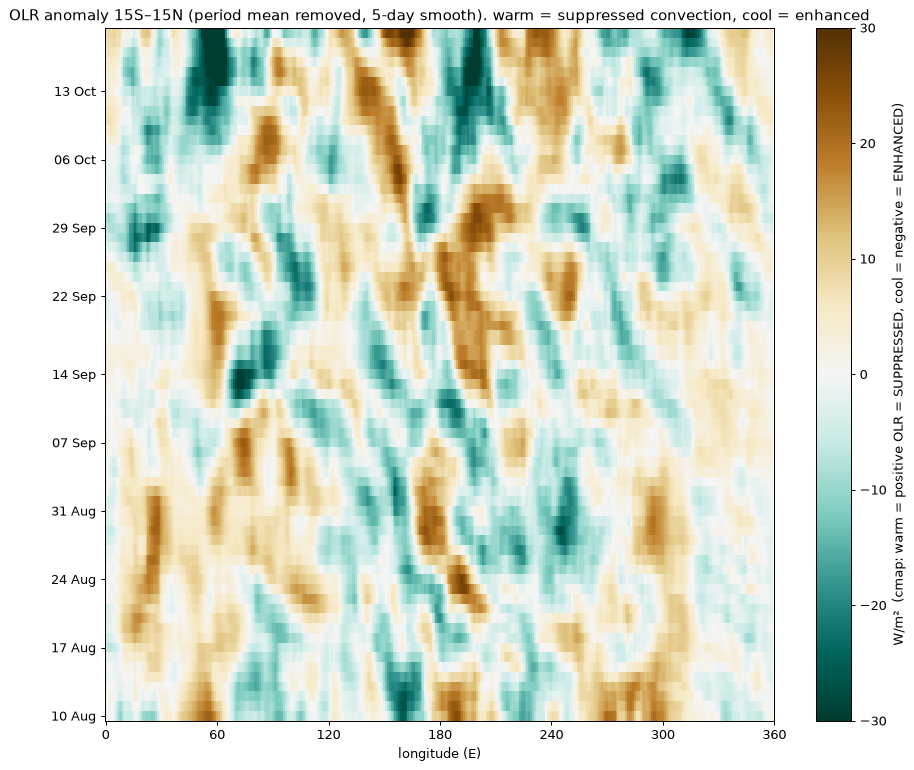
- Forecast tropical OLR for 19–26 Oct barely changed between runs (3–6 W/m² by sector, against an El Niño-like background of ±30).
- An MJO-like eastward signal is visible, with a new phase over the western Indian Ocean around 13–19 Oct. This is a visual read only; the RMM index was not computed.
Show the OLR figures
Caveats, corrections and future work
Caveats
- The analysis uses the medium-range ensemble (0.25°, thinned to 1°), not the extended-range product. They agree on the flip.
- "Best estimate" rainfall is the HRES day-1 forecast, not observations. Jet speeds are geostrophic.
- The data show where analyses and forecasts diverged, but not which observations fed each analysis.
- Correlations across members show association, not cause. Rain and 700 hPa ascent stand in for latent heating.
- AIFS short-wave tracking uses vorticity derived from 500 hPa heights (checked against the true-vorticity track on the analyses).
- Observations are radiosondes only (IGRA2, quality flags not applied); aircraft and satellite data are not in the open record. Steering uses the 500 hPa geostrophic wind at a single level.
Changed since the first version
- Koguma demoted from "possible root cause" to context: the packet it seeded was forecast well.
- The chance level for hemisphere-wide correlations is about 0.46–0.56, not 0.4. Only the strongest links are kept.
- Koguma's pressure is quoted as the ensemble mean (about 972 hPa), not the deepest member (953 hPa).
- Short wave traced (frame 7): the "northern stream" origin is now a tracked feature with a two-step forecast error.
- Latent-heating check (frame 6): heating did not drive the deepening. This replaces the earlier "very likely reinforced the split".
- AIFS-ENS cross-check (frame 10): the machine-learnt ensemble made the same error.
- Observations and steering (frame 8): no large missed feature at landfall; the error grew over land around the wave.
- Four Corners low (frame 9): real, well forecast, and a phasing partner for the northern wave; not the source of the error.
Possible next steps
- AIFS initial-condition experiment (priority). Re-run ECMWF's open-weights AIFS model from the 13 Oct 00z analysis in several versions: unchanged; with the Four Corners low weakened or removed; with the northern short wave deepened; and with the ridge behind it sharpened. If the "sharper ridge" or "deeper wave" versions flip the UK week and the "no low" version blocks it, that would turn the associations in frames 7–9 into tested cause and effect. Practical on a GPU workstation; several hours per forecast on a laptop CPU.
- Deep-layer steering and potential-vorticity diagnostics around the short wave on 14–16 Oct with full-resolution data, to separate steering from the wave's own development.
- Examine the jet streak and upper-level wave structure around the short wave on 16–17 Oct with full-resolution data, to find what the 14 Oct run missed.
- Compare the ECMWF MJO (RMM) forecast between the 13 and 16 Oct runs.